
Cumulative Delta in Thinkorswim
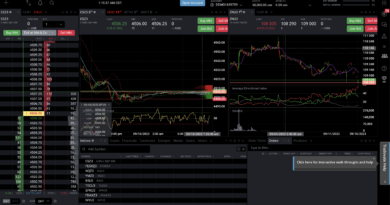
The Cumulative Volume Delta (CVD) in Thinkorswim is a nifty tool that helps you track the changing volumes of buying and selling transactions. By default, it’s hidden but you can make it appear by clicking on the arrow icon below the ladder.
What does the Cumulative Delta in Thinkorswim Show?
The default setting displays two representations of cumulative volume delta: two line plots at the bottom of the chart, and two gauges on the right-hand panel. These dual representations are due to the default ‘split view’ setting, showing separate values for both buying and selling transactions. You can alter these settings to start fresh daily, which you can tweak in the session start settings or configuration window.
Why is this Important?
By utilizing Cumulative Delta in Thinkorswim, you’re empowered to compare the volumes of buyer and seller transactions. This functionality serves as a magnifying glass into the market’s dynamics, providing insights into which group, buyers or sellers, is exerting more pressure at a given moment. This tool can act as your compass, guiding you through the market’s currents and trends.
For instance, if the buying volumes are persistently surpassing the selling volumes, this could suggest a bullish market sentiment, where buyers are willing to pay more, driving prices up. On the contrary, if sellers dominate, consistently outperforming buyers, it might hint at a bearish sentiment, with an oversupply leading to dropping prices. By keeping an eye on this shifting balance between buying and selling pressures, traders can leverage the Cumulative Delta data in Thinkorswim to make more informed decisions, thereby potentially enhancing their trading strategies.
How to Set Up Cumulative Delta in Thinkorswim

Step 1: Access Settings
First, right-click on the indicator to open the settings. Here, you’ll find the active Cumulative Volume Delta tab for the default CVD instance.
Step 2: Customize Order Size Filters
You can determine the minimum and maximum volume size to be considered in the CVD calculation here.
Step 3: Choose Indicator Range
You can select whether values should accumulate since the session start time (session range) or over a time period defined by the current chart size (chart range). Be aware that altering the chart’s size could significantly affect the displayed values.
Step 4: Determine Reset Points
Decide when you want CVD values to reset, as they will start accumulating again post-reset. You can also specify multiple reset points and the frequency of resets.
Step 5: Opt for a Combined View
If you prefer, deactivate the ‘Split buyers/sellers’ checkbox to have all values displayed in one line plot and one gauge.
Step 6: Personalize Your View
Customize the color of the positive (buy side) and negative (sell side) values.
Step 7: Reset Values Instantly
You can hit ‘Reset now’ to immediately reset the values.
Step 8: Add More CVD Instances
You might want to track CVD for different volume sizes or time ranges, or set a different reset schedule. To do so, click on the ‘+’ at the top of the window, give a name to this indicator, pick colors for positive and negative CVD values, and click ‘Create’. This will show extra line plots and gauge(s), and a new tab will be added to the configuration window.
Step 9: Control Display of Multiple CVD Instances
If you have multiple CVD instances, you can control how they’re shown on the lower chart with options like ‘Symmetrical’, ‘Include 0’, and ‘Compact’.
Customize Display of Cumulative Delta in Thinkorswim

After setting up your Cumulative Volume Delta (CVD) indicators in Thinkorswim, you are not bound by a static presentation. Thinkorswim’s platform offers lots of ways to make it your own. For instance, you can tweak the display on the right-hand panel to fit your exact needs.
Speaking of personalization, you get to pick your indicator style. Choices include vertical bars, horizontal bars, text, or circles. Each style gives you a different visual cue. This way, you can interpret data in a way that’s best for your trading style.
Now, let’s talk about indicator placement. You’re in control here too. If you want to change the order, it’s simple. Just right-click on any indicator. Then, you can select ‘Move left’ or ‘Move right.’ Keep doing this until everything lines up how you like it.
In summary, Thinkorswim’s CVD tool offers a lot. It’s powerful, yes. But it’s also designed to be user-friendly. You have the freedom to adjust its visual elements. This allows you to create a trading space that helps you perform at your best.