How to use Triple Moving Average Crossover
Forex trading uses many tools. One such tool is the “triple moving average crossover.” It sounds complex, but it’s not. Picture tracking a car’s speed. You wouldn’t record every change. Instead, you’d average out the speed every few minutes. This is your “moving average.” In trading, we use a similar idea with currency values.
Using Triple Moving Average Crossover to Identify Market Signals
We calculate averages for short, medium, and long periods. These periods might be 5, 10, and 20 days. These averages help us spot “signals.” A “buy signal” occurs when the short-term average tops both other averages. At the same time, the medium-term average also surpasses the long-term. This could indicate a rise in currency values.
On the other hand, a “sell signal” happens when the short-term average falls below both other averages. The medium-term average also dips below the long-term. This might suggest a drop in values.
The purpose of using three averages is to avoid “false signals.” These can trick us into thinking a trend is starting. Using three averages can give us more reliable signals.
Using Triple Moving Averages in Forex Trading: A Real-Life Example
Let’s take the example of trading the EUR/USD currency pair. You follow the pair’s value, but not every tiny change. You focus on averages over 5, 10, and 20 days. These are your short, medium, and long-term moving averages.
Applying Moving Averages to Your Trading Strategy
Now, let’s say the 5-day average (short-term) rises above both the 10-day (medium-term) and 20-day (long-term) averages. At the same time, the 10-day average also moves above the 20-day average. This could signal a good time to buy. You predict that the value of EUR/USD is going to increase.
Conversely, if the 5-day average drops below both the 10-day and 20-day averages, and the 10-day average also falls below the 20-day average, this might signal a good time to sell. You predict that the value of EUR/USD is going to decrease.
Using Triple Moving Average Crossover in TradingView
Here’s a step-by-step guide on how to set up a triple moving average crossover system in TradingView:
Step 1: Open TradingView First, visit the TradingView website and log into your account. If you don’t have an account, you’ll need to create one.
Step 2: Choose Your Currency Pair From the top of the screen, select the “Chart” tab. Then type the symbol for the currency pair you want to analyze in the search box at the top of the page, like ‘EURUSD’.
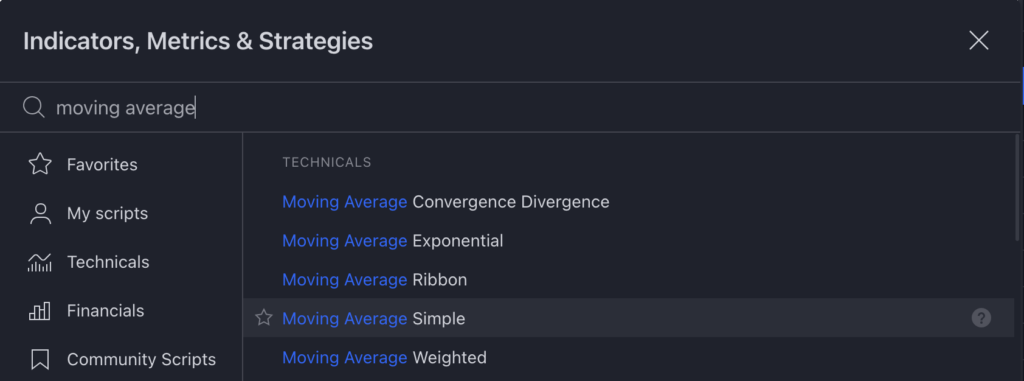
Step 3: Adding the Moving Averages You’ll see the price chart for your chosen currency pair. Now, let’s add the moving averages. Click on the “Indicators” button at the top of the page. In the search box, type “Moving Average.” You need to add this three times because we are creating a triple moving average crossover system.

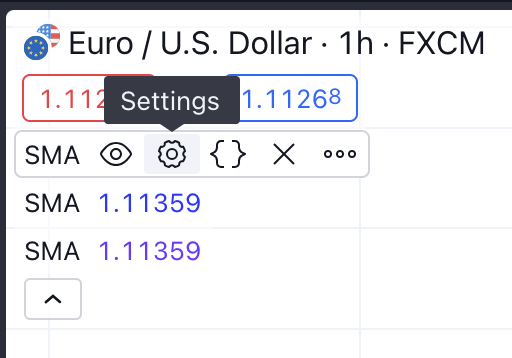
Step 4: Adjust the Settings For each moving average you’ve added, you need to adjust the settings. Click on the ‘gear’ icon next to the moving average label at the top of the chart. In the “Length” field, input the number of periods for each moving average. For example, you could use 5, 10, and 20 periods for your short, medium, and long-term moving averages. Repeat this for each of the moving averages.

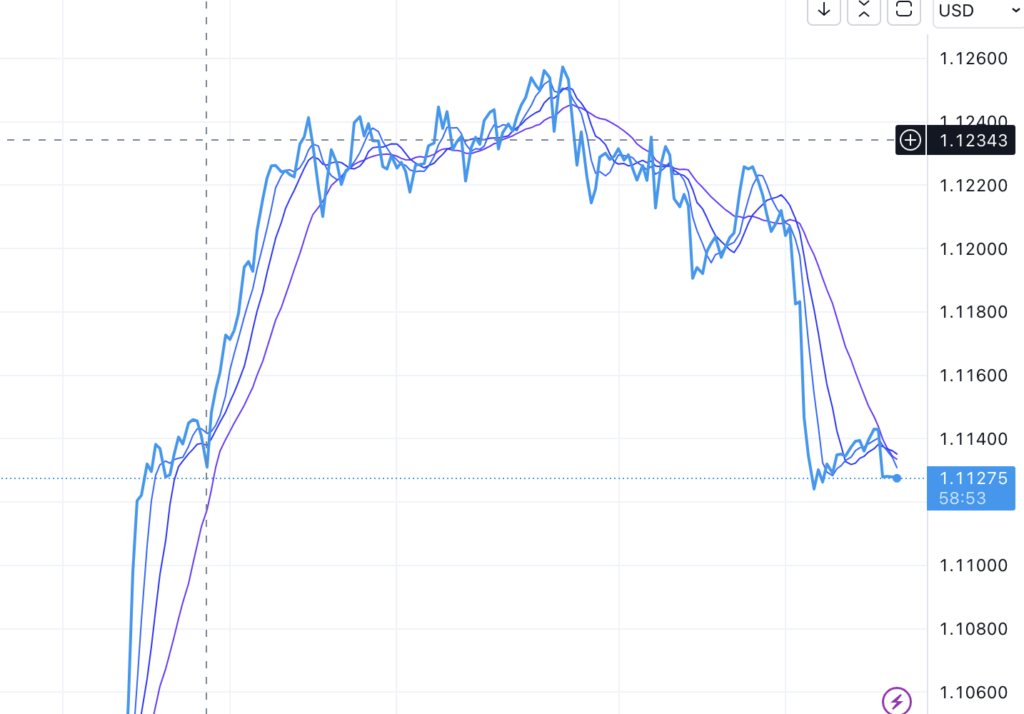
Step 5: Interpreting the Crossover You will now see three moving average lines on your chart. A buy signal is generated when the short-term moving average crosses above both the medium-term and the long-term moving averages, and the medium-term moving average crosses above the long-term moving average. Conversely, a sell signal is generated when the opposite happens.

Using Triple Moving Average Crossover in MetaTrader
Here’s a step-by-step guide on how to set up a triple moving average crossover system in MetaTrader:
Step 1: Open MetaTrader First, open the MetaTrader platform on your computer. If you haven’t downloaded it yet, you can download it from the official MetaTrader website.
Step 2: Choose Your Currency Pair In the “Market Watch” window on the left side of the screen, find the currency pair you’re interested in. Right-click on it and choose “Chart Window” to open its price chart.
Step 3: Adding the Moving Averages At the top of the platform, you’ll see a toolbar with several icons. Find the one that looks like two overlapping mountains and click on it. This is the “Moving Average” tool.
Step 4: Adjust the Settings A window will pop up with several options. Under the “Period” section, input the number of periods for your first moving average. For example, you could use 5 periods for your short-term moving average. Then click “OK.”
Step 5: Repeat for Other Averages Repeat Steps 3 and 4 for your medium-term and long-term moving averages. For example, you could use 10 periods for your medium-term and 20 periods for your long-term moving average.
Step 6: Interpreting the Crossover You should now see three moving average lines on your chart. A buy signal is generated when the short-term moving average crosses above both the medium-term and the long-term moving averages, and the medium-term moving average crosses above the long-term moving average. A sell signal is generated when the opposite happens.


