

Double Bollinger Bands
The world of Forex trading is ever-evolving, with diverse strategies that cater to traders of all expertise levels. One such strategy, tailor-made for both newbies and mid-level traders, is the “Double Bollinger Bands”. But what makes it even more interesting? Its ability to seamlessly align with macro events. In this article, we’ll delve into how to harness its potential to pinpoint tops and bottoms, determine whether you’re in a trend or range, and capitalize on emerging trends.
Content
What Are Double Bollinger Bands?
Picking Tops and Bottoms with Double Bollinger Bands on Daily Charts
Determining Trend vs. Range with Double Bollinger Bands on Daily Charts
Riding the New Trends with Double Bollinger Bands on Daily Charts < MacroFXTrader Favorite
Navigating the FX Waters: Precision and Insight with Double Bollinger Bands on Daily Charts
Guide to Setting Up Double Bollinger Bands in TradingView
What Are Double Bollinger Bands?
Double Bollinger Bands are akin to having a magnified lens into the market’s heartbeat, especially when using daily charts, which offer a comprehensive view of price movements.
- The Middle Line: At the heart of each band is the simple moving average (SMA), which calculates the average of a currency pair’s closing prices over a designated period, typically 20 days on daily charts. This line serves as our primary reference.
- The First Set of Bands (1 Standard Deviation): Surrounding the SMA are the first set of upper and lower bands, determined by adding and subtracting 1 standard deviation from the SMA. This set provides a relatively close view of where the price is in relation to its average.
- The Second Set of Bands (2 Standard Deviations): Beyond the initial bands lies the second set, calculated using 2 standard deviations from the SMA. These bands offer a broader view, capturing more extreme price movements and potential market volatility.
So, why double? By utilizing both 1 and 2 standard deviations, traders can differentiate between moderate price movements and more volatile swings. In scenarios where the price interacts with the outer bands (2 standard deviations), it often indicates more extreme conditions. In contrast, interactions with the inner bands (1 standard deviation) can signal more standard, expected price behaviors.
By employing Double Bollinger Bands on daily charts, traders can better discern the ebb and flow of the market, creating a robust framework for analyzing potential trade opportunities.
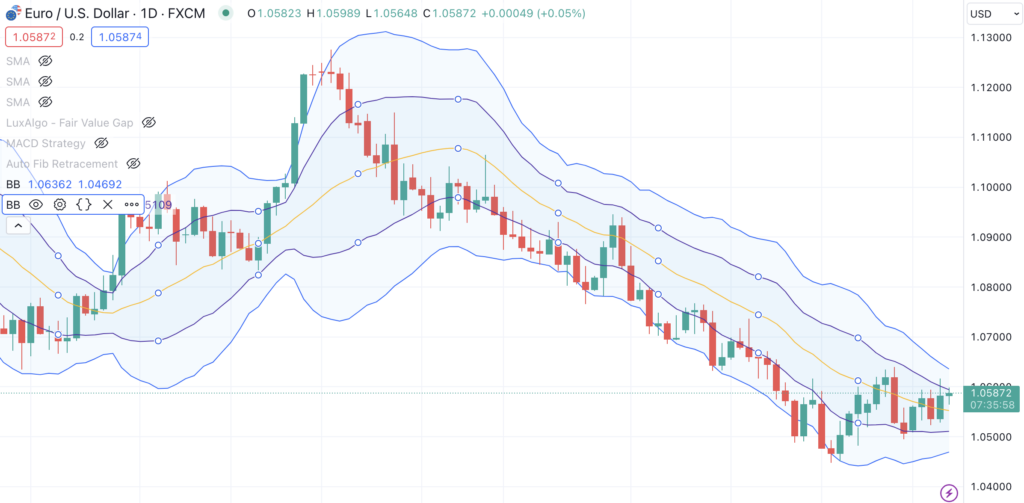
Picking Tops and Bottoms with Double Bollinger Bands on Daily Charts

Harnessing the power of Double Bollinger Bands, especially on daily charts, allows traders to detect and exploit potential market tops and bottoms. Here’s how you can master this technique:
- Spot the Squeeze: The squeeze is a fascinating phenomenon within the Bollinger world. When both sets of bands – those at 1 and 2 standard deviations – come closer together or “squeeze”, it’s a strong hint of reduced market volatility. But here’s the kicker: a squeeze often precedes significant price moves. The tighter the bands get, the more significant the subsequent breakout or breakdown can be.
- Watch the Cross and Understand its Depth:
- Inner Band Interaction: If the currency price approaches or touches the inner bands (1 standard deviation), it’s an initial signal of a potential top (for the upper band) or bottom (for the lower band). However, these interactions often indicate moderate price movements.
- Outer Band Breach: When the price goes beyond the outer bands (2 standard deviations), it’s a stronger indication. Touching or crossing the upper outer band might suggest the market is overextended, while interacting with the lower outer band can imply the market might be undervalued or oversold. Such breaches, especially on daily charts, often signal more extreme price conditions and potential reversals.
- Inner Band Interaction: If the currency price approaches or touches the inner bands (1 standard deviation), it’s an initial signal of a potential top (for the upper band) or bottom (for the lower band). However, these interactions often indicate moderate price movements.
- Macro Events – The X Factor: While the bands give visual cues, macro events are the underlying drumbeats that can amplify or change the tune. If there’s a significant economic announcement on the horizon, it can act as a catalyst. For instance, a central bank‘s decision on interest rates might push the currency price to touch or cross the outer bands. Being aware of such events can provide context to band movements and help in anticipating the market’s next steps.
By integrating these insights into your trading routine, you’ll be better positioned to spot potential tops and bottoms. Double Bollinger Bands, combined with daily chart analysis and macro events, can be a formidable trio in your trading arsenal.
Determining Trend vs. Range with Double Bollinger Bands on Daily Charts
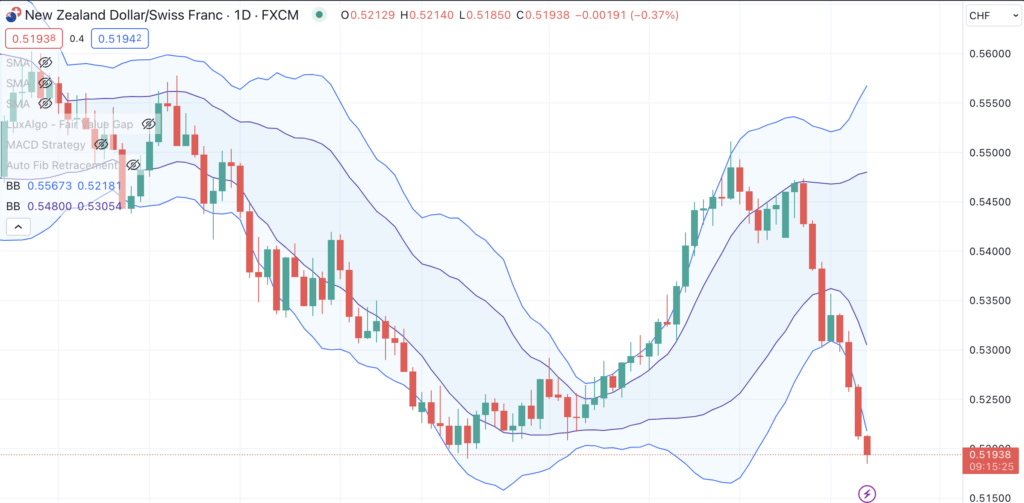
In the expansive world of Forex trading, understanding the market’s state — whether it’s trending or ranging — is crucial. The Double Bollinger Bands, particularly when analyzed on daily charts, offer a concise method to make this distinction. Let’s break down the process:
- Within the Bands – The Calm Sea:
- Oscillating Movements: When you observe the currency price moving back and forth between the two inner bands (1 standard deviation), it’s a hallmark of a ranging market. In simpler terms, the market is in a consolidation phase, lacking a clear directional bias.
- Significance on Daily Charts: Such range-bound behavior on daily charts often lasts for extended periods, providing multiple opportunities for ‘buy low, sell high’ or ‘sell high, buy low’ strategies, especially within the confines of the inner bands.
- Oscillating Movements: When you observe the currency price moving back and forth between the two inner bands (1 standard deviation), it’s a hallmark of a ranging market. In simpler terms, the market is in a consolidation phase, lacking a clear directional bias.
- Outside the Bands – Riding the Waves:
- Consistent Positioning: If the currency price not only touches but maintains a position outside the inner bands, especially approaching or moving beyond the outer bands (2 standard deviations), it’s a sign of a strong trend. Such behavior indicates sustained bullishness (for upward trends) or bearishness (for downward trends).
- Daily Chart Implications: Trends identified on daily charts are significant. They often signal prolonged bullish or bearish market phases, which, when combined with other technical and macro factors, can offer lucrative trend-following opportunities.
- Consistent Positioning: If the currency price not only touches but maintains a position outside the inner bands, especially approaching or moving beyond the outer bands (2 standard deviations), it’s a sign of a strong trend. Such behavior indicates sustained bullishness (for upward trends) or bearishness (for downward trends).
- Transition Phase – The Gray Area: Sometimes, the price might exit a range (break from the inner bands) but not yet establish a strong trend (not consistently touch or breach the outer bands). This interim phase is crucial. It’s the market’s way of hinting at a potential transition from range to trend or vice versa. Being vigilant during this phase, while also keeping an eye on macro events, can prepare traders for upcoming substantial moves.
Mastering the art of identifying trends and ranges using Double Bollinger Bands on daily charts can significantly enhance trading decisions. By recognizing these market states, traders can apply strategies tailored for each environment, optimizing potential rewards while managing risks.
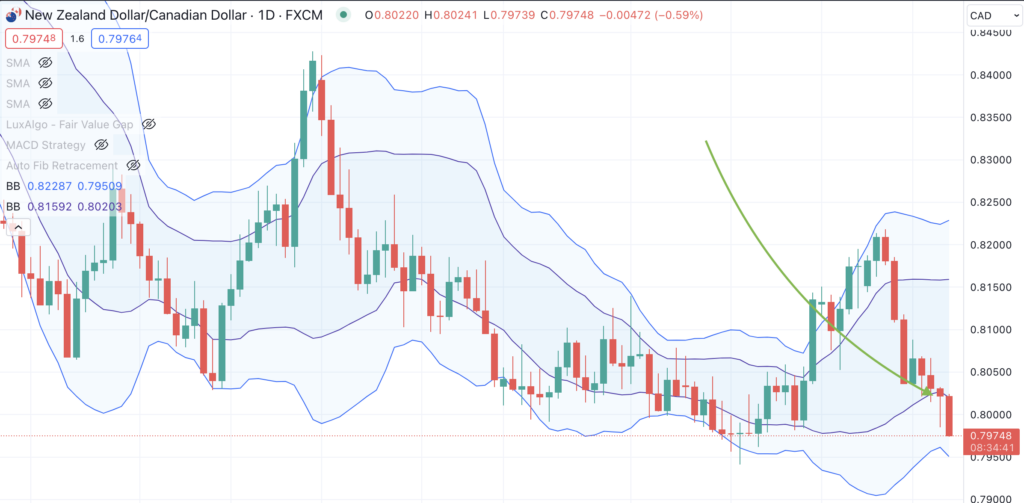
Riding the New Trends with Double Bollinger Bands on Daily Charts
In the FX market, catching a new trend early is like catching a wave in surfing — it can lead to exhilarating profits. Using Double Bollinger Bands on daily charts offers a methodical approach to navigate these waters. Here’s a detailed breakdown:
- Spot the Breakout – The Starting Gun:
- End of the Squeeze: The squeeze, a period when the bands converge, won’t last forever. Its end is usually marked by the price breaking away from this confinement. This breakout is the market’s initial whisper of a potential new trend.
- Directional Hints: Observing which band the price breaks towards is pivotal. If it surges above the upper middle band (1 standard deviation), it often heralds the beginning of an upward trend. Conversely, a descent below the lower middle band can be the market’s nod towards a potential downward trend.
- End of the Squeeze: The squeeze, a period when the bands converge, won’t last forever. Its end is usually marked by the price breaking away from this confinement. This breakout is the market’s initial whisper of a potential new trend.
- Join the Momentum – Riding the Wave:
- Entry Points: After identifying the trend’s direction, the next challenge is finding an optimal entry point. Look for retracements or minor pullbacks that touch the middle band or the respective inner band, providing potential entry opportunities in the direction of the prevailing trend. What we and Kathy Lien recommends is to enter at the New York close if the two days previous candles ends within the range of Bollingers 1. deviation bands and the current daily candle ends up or down within the 2. deviation bands as shown in the figure below.
- Safety First: While trends can be powerful, they aren’t guaranteed. Always set stop-losses. On daily charts, a reversal or breach of the middle band or the opposing inner band can be a good reference point for stop placements, ensuring capital is protected from unexpected trend reversals. In general a stop 65 pips from the entry price is a good choice and closing half the position when the amount risked has been won. At the same time move the stop to the entry price and evaluate where the limit for the rest of the position should be set. Around 195 pips from entry is often a good choice using this strategy. You can also consider using a trailing stop instead, but you risk being stopped premature.
- Entry Points: After identifying the trend’s direction, the next challenge is finding an optimal entry point. Look for retracements or minor pullbacks that touch the middle band or the respective inner band, providing potential entry opportunities in the direction of the prevailing trend. What we and Kathy Lien recommends is to enter at the New York close if the two days previous candles ends within the range of Bollingers 1. deviation bands and the current daily candle ends up or down within the 2. deviation bands as shown in the figure below.
- Macro Event Alert – The Wind Beneath Your Wings:
- Economic Calendars: Keep a close watch on economic calendars. Major events, such as central bank announcements or significant economic data releases, can either amplify or challenge the prevailing trend.
- Synchronized Decisions: If a macro event’s outcome aligns with your trend analysis, it acts as a tailwind, boosting your confidence in the trade. However, if it opposes the trend, it might be prudent to reassess your position and strategy.
- Economic Calendars: Keep a close watch on economic calendars. Major events, such as central bank announcements or significant economic data releases, can either amplify or challenge the prevailing trend.
By understanding the intricacies of riding new trends using Double Bollinger Bands on daily charts, traders can not only enhance their profit potential but also make informed decisions, balancing reward expectations with risk management.
Navigating the FX Waters: Precision and Insight with Double Bollinger Bands on Daily Charts
In the intricate and ever-evolving realm of Forex trading, the mastery of a proven strategy can be a trader’s North Star. The Double Bollinger Bands, especially when implemented on daily charts, emerge as more than just a tool—they become a comprehensive lens, revealing the hidden nuances of market movements. From pinpointing potential market tops and bottoms, distinguishing the calm of range-bound markets from the fervor of robust trends, to harnessing the pivotal cues from macroeconomic events, this strategy offers traders a structured pathway. Yet, it’s crucial to note that while tools and techniques illuminate the path, the journey’s success is rooted in continuous learning, disciplined practice, and an unwavering commitment to informed decision-making.
Embrace this refined approach, and let the Double Bollinger Bands guide your steps in the vast dance of Forex trading.
Guide to Setting Up Double Bollinger Bands in TradingView:
- Access TradingView:
- Navigate to the TradingView website.
- Log in to your account. If you don’t have one, you can create an account or continue using the platform as a guest.
- Select Your Chart:
- Choose the currency pair or financial instrument you wish to analyze.
- Ensure you’re on the ‘Chart’ view, which provides the detailed graphical interface.
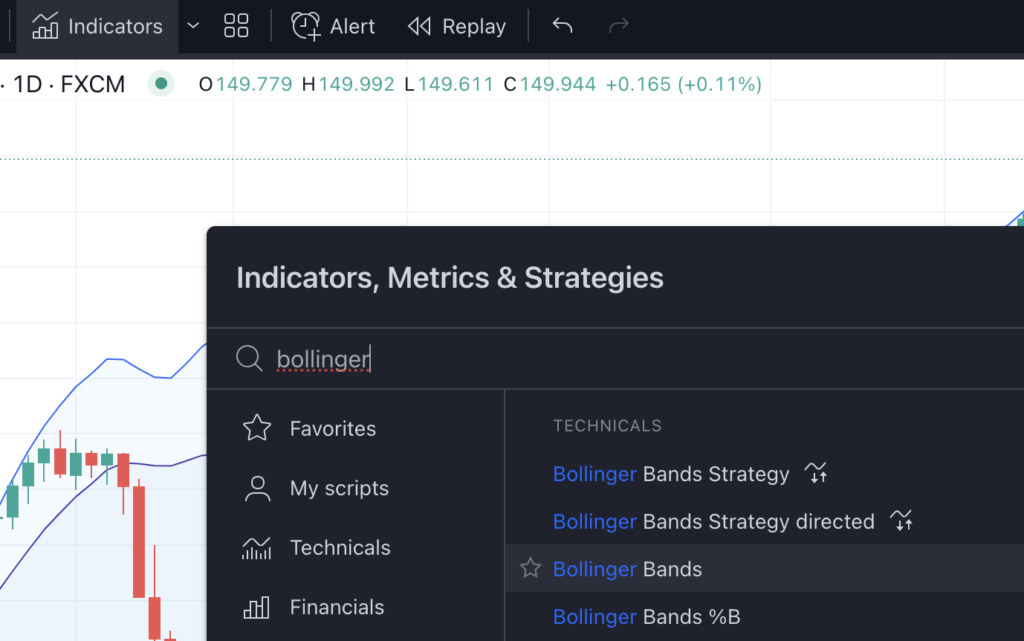
- Add the First Set of Bollinger Bands:
- On the top toolbar, find the “Indicators” icon (it looks like a flask). Click on it.
- In the search bar that appears, type “Bollinger Bands” and select it from the dropdown list.
- This will add the default Bollinger Bands to your chart.
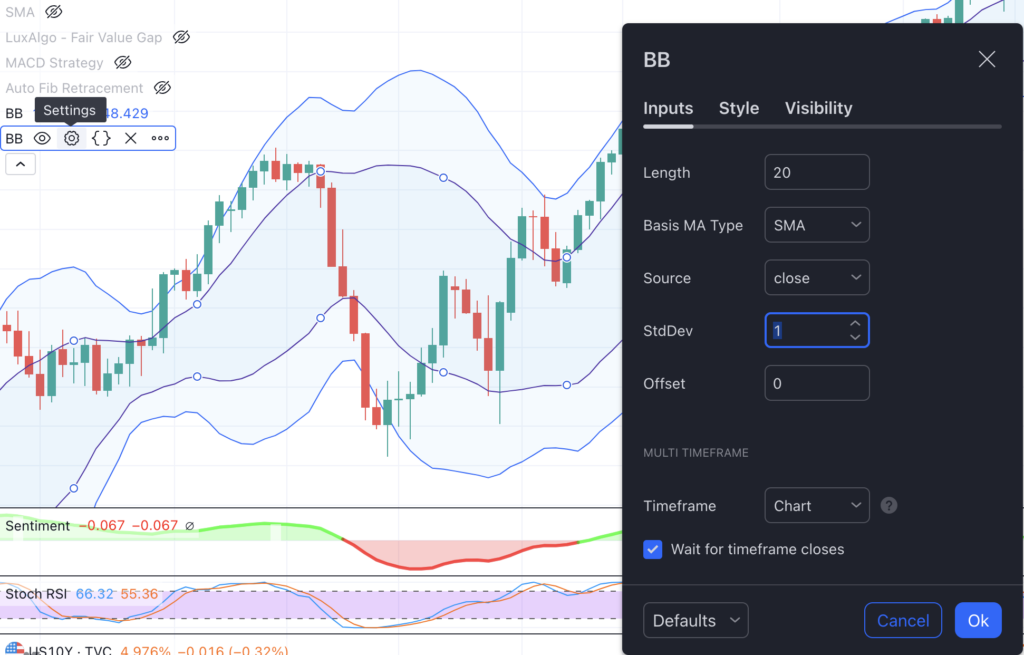
- Adjust to 1 Standard Deviation:
- Click on the settings/gear icon next to the name of the Bollinger Bands in the upper left corner of your chart.
- A settings menu will pop up. Locate the ‘Inputs’ tab.
- Change the ‘Length’ to 20 (if it isn’t already) and the ‘Source’ to ‘Close’.
- Adjust the ‘Std Dev’ (Standard Deviation) to 1.
- Click “OK”.
- Add the Second Set of Bollinger Bands:
- Repeat the process: Click on the “Indicators” icon, search for “Bollinger Bands”, and add it to your chart.
- Repeat the process: Click on the “Indicators” icon, search for “Bollinger Bands”, and add it to your chart.
- Adjust to 2 Standard Deviations:
- Again, click on the settings/gear icon for this new set of bands.
- In the ‘Inputs’ tab, ensure the ‘Length’ is set to 20 and the ‘Source’ is ‘Close’.
- This time, adjust the ‘Std Dev’ to 2.
- Click “OK”.
- Customize Appearance (Optional):
- If you want to differentiate between the two sets of bands, you can change the color, style, or thickness of each band set. Access the settings for each and navigate to the ‘Style’ tab. From here, you can adjust the appearance as desired.
- If you want to differentiate between the two sets of bands, you can change the color, style, or thickness of each band set. Access the settings for each and navigate to the ‘Style’ tab. From here, you can adjust the appearance as desired.
- Review Your Chart:
- You should now see two sets of Bollinger Bands on your chart: one reflecting 1 standard deviation and the other 2 standard deviations from the 20-day moving average.
With these steps, you’ll have successfully set up Double Bollinger Bands on TradingView. This visual setup can aid in your analysis, helping you spot potential trading opportunities in line with the strategies we discussed earlier.