
Understanding GMMA: The Gateway to Effective Forex Trading
The journey to successful forex trading is often filled with complex strategies and analytical tools. One tool that every aspiring trader should understand is GMMA, or Guppy Multiple Moving Averages. This robust technical analysis tool, developed by Australian trader Daryl Guppy.
Content in this article
Learn what GMMA is and how to profit from it
Decoding the Market with GMMA: Spotting Bullish and Bearish Trends
The Backbone of GMMA: A Deeper Dive into Exponential Moving Averages
A Meeting of Two Minds – Understanding Short-Term and Long-Term Perspectives
A Vital Tool, Not an All-Encompassing Solution
Complementing GMMA: Building a Robust Trading Strategy
Applying GMMA to Forex Trading: A Strategy for Success
“How to Add GMMA to Your Chart” Guides
Adding GMMA to Your Chart in TradingView: A Step-by-Step Guide
Adding GMMA to Your Chart in MetaTrader: A Step-by-Step Guide
Adding GMMA to Your Chart in Thinkorswim: A Step-by-Step Guide
Adding GMMA to Your Chart in Interactive Brokers’ Trader Workstation: A Step-by-Step Guide
Adding GMMA to Your Chart in eToro: A Step-by-Step Guide
Adding GMMA to Your Chart in NinjaTrader: A Step-by-Step Guide
Decoding the Market with GMMA: Spotting Bullish and Bearish Trends

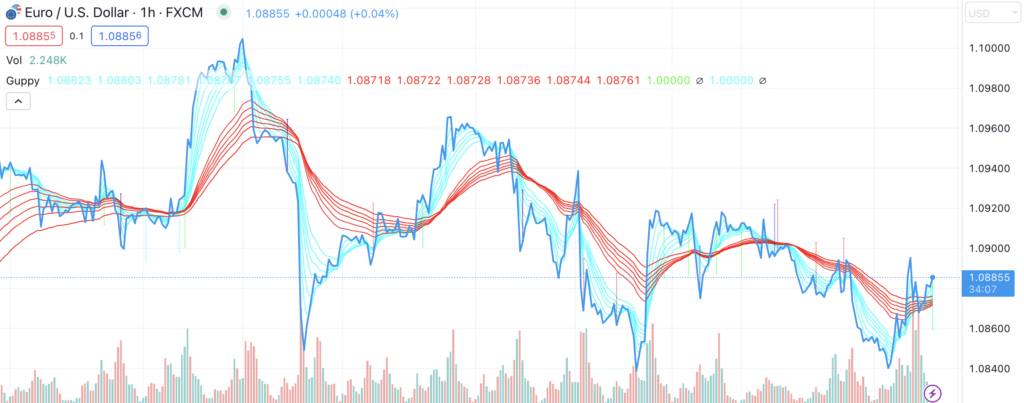
The true power of GMMA becomes evident in understanding the relationship and interaction between the two groups of EMAs (Exponential Moving Average). These interactions provide vital clues about the market’s directional bias, allowing traders to spot potential bullish or bearish trends.
When the short-term EMAs cross above the long-term ones, the market is often signaling an upcoming bullish trend. This crossover indicates that the sentiment among short-term traders—those who are usually first to react to recent market changes—is turning positive. They are starting to buy, pushing prices up. If the long-term EMAs follow suit and start trending upwards, this confirms the bullish trend, indicating that long-term investors are also starting to buy, providing a broader market confirmation.
Conversely, when the short-term EMAs cross below the long-term group, this may indicate an impending bearish trend. In this scenario, short-term traders are starting to sell their positions, creating downward pressure on prices. If long-term investors also start to sell, as indicated by their EMAs moving downward, it confirms the bearish trend.
In addition to these simple crossovers, the distance between the two groups of EMAs can also provide crucial insights. A widening gap typically indicates increasing momentum in the current trend. A narrowing gap, on the other hand, may suggest that the current trend is slowing and could be about to reverse.
But remember, while the GMMA provides valuable signals, it should be used as part of a comprehensive trading strategy. Combining GMMA with other technical indicators and fundamental analysis can enhance its effectiveness and lead to better trading decisions.
This power to decode the market’s likely direction is what makes GMMA an indispensable tool for forex traders. It allows them to anticipate market movements, adapt their strategies accordingly, and improve their chances of trading success.
The Backbone of GMMA: A Deeper Dive into Exponential Moving Averages
For a more profound understanding of GMMA, we must first deepen our knowledge about Exponential Moving Averages (EMAs). The EMA is a type of moving average that gives more weight to recent price data, distinguishing it from the Simple Moving Averages (SMAs).
Unlike SMAs, which consider all data points with equal importance, EMAs are designed to react more significantly to recent changes. This design feature is based on the theory that the most recent price movements are more relevant to predicting future price movements. Thus, an EMA gives forex traders a better idea of the market’s current momentum.
Furthermore, EMAs minimize the lag in their response to price changes. The lag in moving averages is the discrepancy between the time a price change occurs and the time at which that change is reflected in the moving average. With an EMA, due to the heavier weight on recent data, this lag is minimized, allowing traders to get a more timely and accurate understanding of market trends.
Overall, the EMA’s focus on recent data, its swift reaction to price changes, and the minimized lag make it a more precise tool for understanding the current market condition. And by using GMMA, which leverages the power of multiple EMAs, forex traders can gain a broader, more detailed picture of market trends.
A Meeting of Two Minds – Understanding Short-Term and Long-Term Perspectives

The beauty of the Guppy Multiple Moving Averages lies in its dual approach to market analysis. The GMMA seamlessly marries two sets of Exponential Moving Averages (EMAs), each reflecting a different segment of market participants: short-term traders and long-term investors.
The first set of EMAs within the GMMA caters to the short-term traders. This group, often known as the fast group, includes EMAs for recent periods of 3, 5, 8, 10, 12, and 15 days. These traders, also referred to as speculators or retail traders, are quick to react to new information or market changes. They tend to enter and exit trades swiftly, looking to profit from small price movements over a short period. The rapid reaction time of these EMAs accurately captures the sentiment and trading behavior of this group.
On the other end of the spectrum, the GMMA also incorporates a long-term group of EMAs, designed to reflect the actions of institutional or long-term investors. This group consists of EMAs for more extended periods, specifically 30, 35, 40, 45, 50, and 60 days. Long-term investors have a more patient approach, holding their positions for weeks or even months. They focus more on underlying economic fundamentals rather than short-term fluctuations. The longer-term EMAs in GMMA depict the behavior of these market participants, showing the broader trend in the market.
The combination of these two perspectives within a single framework is what gives the GMMA its unique edge. It allows traders to get a more holistic view of market sentiment, considering both the frenetic pace of short-term traders and the more gradual, calculated moves of long-term investors. By understanding the interplay between these two groups through the lens of GMMA, traders can anticipate potential trend changes and make more informed trading decisions.
A Vital Tool, Not an All-Encompassing Solution
The GMMA offers powerful insights into market trends, helping traders spot potential opportunities and risks. However, it’s crucial to remember that this tool, like any other, has its limitations. No single tool or strategy can provide a foolproof, complete understanding of the dynamic and complex forex market.
Foremost, GMMA is a trend-following tool, designed to work best in trending markets. It allows traders to spot the onset of a new trend, follow its progress, and identify when it might be ending. However, when the market is moving sideways or is range-bound—essentially, when there is no clear trend—GMMA might not be as effective. In these conditions, other strategies or indicators that are designed specifically for range-bound markets may prove to be more useful.
Another aspect to bear in mind is that GMMA, as a type of moving average, is a lagging indicator. This means it uses past price data to generate its signals. While this can provide a good picture of the market’s historical trends, it does have a drawback. Lagging indicators, by their nature, might not react quickly enough to sudden market changes or unforeseen events. They might not always provide an accurate prediction about future price movements.
As such, while GMMA is an invaluable tool for trend identification and analysis, it should be used as part of a comprehensive trading strategy. This strategy should ideally incorporate other technical indicators and fundamental analysis to account for the diverse factors that can influence forex prices. By combining GMMA with other tools and techniques, traders can build a robust, well-rounded approach to navigating the forex market.
Complementing GMMA: Building a Robust Trading Strategy

While GMMA is a powerful tool for analyzing market trends, its true potential shines when combined with other technical indicators within a more comprehensive trading strategy. This approach helps mitigate some of the limitations inherent in any single technical indicator, including the GMMA.
A popular combination involves using GMMA alongside indicators like the Relative Strength Index (RSI), Moving Average Convergence Divergence (MACD), or Bollinger Bands. Each of these indicators provides a different perspective on the market, thereby supplementing the insights gained from GMMA.
RSI, for example, is a momentum oscillator that measures the speed and change of price movements, helping to identify overbought or oversold conditions. Meanwhile, MACD is a trend-following momentum indicator that reveals the relationship between two EMAs of a security’s price, providing signals for potential buy and sell opportunities. Bollinger Bands, on the other hand, measure market volatility and can help identify if the price is high or low on a relative basis.
Incorporating these additional indicators can significantly improve the robustness of a GMMA-based trading strategy. They can help confirm the signals given by GMMA, reducing the likelihood of false alarms and providing additional layers of safety. For instance, if GMMA indicates a bullish trend, but RSI shows the market is overbought, traders might choose to wait for further confirmation before entering a trade.
It’s essential to remember that while GMMA provides insightful data about market trends, it’s not a standalone solution. Rather, it should be viewed as a crucial component of a more comprehensive trading strategy—one that considers multiple technical indicators and also factors in fundamental analysis, risk management principles, and the trader’s individual goals and risk tolerance.
Applying GMMA to Forex Trading: A Strategy for Success
The world of forex trading is a dynamic, rapidly changing field. It demands constant vigilance, flexibility, and an adaptive strategy from its participants. That’s where tools like GMMA come into play. Implementing GMMA into a trading strategy can provide traders with a much-needed edge in this competitive market.
Utilizing GMMA gives traders a more nuanced, detailed understanding of market trends. It does this by consolidating the perspectives of two distinct market participant groups: short-term traders and long-term investors. By monitoring the interactions between these groups—represented by short-term and long-term EMAs—traders gain a unique view of market sentiment and momentum.
These insights can help traders identify potential opportunities. For instance, a bullish crossover may be a good time to consider entering a long position, while a bearish crossover might signal the right moment to sell or short a position. The distances between the EMAs can also provide clues about the strength or weakness of a trend, allowing traders to adjust their strategies accordingly.
Furthermore, the GMMA’s emphasis on trends aligns well with one of the essential mantras of trading: “the trend is your friend.” By helping traders identify and stick with the trend, the GMMA can help them avoid some of the pitfalls of countertrend trading, which can be riskier, especially for less experienced traders.
In conclusion, implementing GMMA in forex trading can equip traders with valuable insights to make more timely and informed decisions. By helping traders understand the underlying market trends, the GMMA aids in reducing uncertainty, enabling traders to act decisively and ultimately achieve their trading objectives. As with any tool, the effectiveness of GMMA will depend largely on the trader’s understanding and correct application. So, take the time to learn, practice, and master the GMMA – it could be a game-changer in your trading journey.
Harnessing the Power of GMMA: A Case Study

Let’s explore a practical scenario to illustrate the effectiveness of GMMA in forex trading. Consider a trader who’s analyzing the EUR/USD pair—a key forex trading pair given the economic strength of the Eurozone and the United States. The trader wishes to determine whether to go long (buy) or short (sell) on this pair. Here is where the GMMA can prove indispensable.
Our trader applies the GMMA to the EUR/USD chart and closely monitors the interactions between the short-term and long-term EMAs. After some time, they observe that the short-term EMAs have crossed above the long-term EMAs. In the language of GMMA, this crossover suggests a potential uptrend, hinting that it might be a good time to go long on the EUR/USD pair.
However, our savvy trader knows better than to rely solely on one indicator. They bring other technical indicators like the RSI and MACD into play to confirm the GMMA’s signal. The RSI does not indicate an overbought condition, and the MACD line has crossed above the signal line, both confirming the bullish signal from the GMMA.
Having received confirmation from multiple indicators, the trader decides to enter a long position, betting that the value of the EUR/USD pair will indeed rise. As predicted, the pair’s value ascends in the subsequent period, validating the trader’s decision. This scenario is a textbook example of how GMMA, in combination with other indicators, can significantly enhance a trader’s decision-making process.
Of course, it’s important to note that while this case study showcases a successful application of GMMA, it doesn’t guarantee success in every trade. The forex market is influenced by a multitude of factors, and risk is an inherent part of trading. Nonetheless, using tools like GMMA can undoubtedly increase the odds of making profitable trades by providing a better understanding of market trends.
The Takeaway: Navigating Forex Markets with GMMA
Stepping into the world of forex trading can be an intimidating experience, particularly for newcomers. The market’s dynamism, the myriad of economic factors influencing currency movements, and the sheer volume of information to process can seem overwhelming. However, tools like GMMA can play a crucial role in unraveling the intricacies of market trends and providing a clearer picture of what’s happening.
The power of GMMA lies in its ability to provide a nuanced view of market sentiment by integrating the perspectives of different market participant groups. This can significantly aid traders in making more informed and confident decisions. However, it’s important to remember that GMMA isn’t a magic wand that guarantees trading success. It doesn’t provide foolproof predictions or eliminate the inherent risks associated with trading.
What GMMA does offer is valuable, actionable insights into market trends. When these insights are combined with other technical indicators, a disciplined approach to risk management, and a well-thought-out trading strategy, they can greatly enhance a trader’s chances of success.
In essence, GMMA should be viewed as a compass guiding traders through the often turbulent waters of the forex market. By helping traders understand the direction and strength of market trends, it provides a sense of direction and purpose, enabling them to navigate the market with increased certainty and confidence. As with any tool, the key to harnessing the power of GMMA lies in understanding its functionality deeply and applying it judiciously within a broader, diversified trading strategy.
Adding GMMA to Your Chart in TradingView: A Step-by-Step Guide
TradingView is a popular platform among forex traders due to its user-friendly interface and the wide array of technical indicators it offers, including GMMA. Here is a step-by-step guide on how to add GMMA to your chart in TradingView:
- Open the TradingView platform: You can either use the web version or the downloadable app, depending on your preference.
- Choose your trading pair: In the top left corner, you’ll see a search bar where you can type in the forex pair you want to analyze. For example, if you want to analyze the EUR/USD pair, type “EURUSD” and select the appropriate option from the dropdown menu.
- Add GMMA to your chart: Once you have your forex pair chart open, go to the top of the screen and find the button that says “Indicators“. Click on it and a search bar will appear. Type in “Guppy Multiple Moving Average” or “GMMA” and select it from the dropdown menu. Upon selection, the GMMA will be automatically added to your chart.
- Customize your GMMA (optional): The standard GMMA uses specific periods for its short-term and long-term moving averages. However, you can customize these if you prefer. To do this, click on the settings icon (which looks like a gear) next to the “Guppy Multiple Moving Average” label above your chart. Here, you can change the lengths of the short-term and long-term moving averages as per your needs.
- Analyze the market: With the GMMA added to your chart, you can now start analyzing the market. Look for interactions between the two groups of moving averages to spot potential trading opportunities.
Adding GMMA to Your Chart in MetaTrader: A Step-by-Step Guide
- Open the MetaTrader platform: You can either use MetaTrader 4 or MetaTrader 5, depending on your preference.
- Choose your trading pair: In the “Market Watch” window on the left side of the screen, you can select the forex pair you want to analyze. If the pair you want is not displayed, right-click in the “Market Watch” window and select “Show All”.
- Open a chart for the pair: Once you have selected your pair, right-click on it in the “Market Watch” window and select “Chart window”. A new chart will open for the pair.
- Add GMMA to your chart: By default, MetaTrader does not come with GMMA as a built-in indicator. However, it allows you to add custom indicators. You can find the GMMA indicator file (which has a .mq4 or .mq5 extension) online, download it, and save it in the ‘Indicators’ folder in the MetaTrader directory on your computer. Once you’ve done that, close and restart the MetaTrader platform. The GMMA indicator should now be available in the “Navigator” window. Simply drag and drop it onto your chart to apply it.
- Customize your GMMA (optional): Just like in TradingView, you can customize the periods of the moving averages in MetaTrader as well. To do this, right-click on your chart, select “Indicators List”, find GMMA in the list, and click “Edit”. Here, you can change the lengths of the short-term and long-term moving averages as you wish.
- Analyze the market: With the GMMA added to your chart, you can now start analyzing the market. Look for interactions between the two groups of moving averages to identify potential trading opportunities.
Adding GMMA to Your Chart in ThinkOrSwim: A Step-by-Step Guide
TD Ameritrade‘s ThinkOrSwim platform is a comprehensive trading platform used by many traders worldwide. Though it does not come with a pre-built GMMA indicator, you can create it using ThinkOrSwim’s flexible scripting language, known as thinkScript. Here is a step-by-step guide on how to add GMMA to your chart in ThinkOrSwim:
- Open the ThinkOrSwim platform: You can either use the web version or the downloadable desktop version, depending on your preference.
- Choose your trading pair: In the upper left corner, you’ll see a search bar where you can type in the forex pair you want to analyze. For example, if you want to analyze the EUR/USD pair, type “EURUSD” and select the appropriate option from the dropdown menu.
- Create GMMA for your chart: Once you have your forex pair chart open, click on the “Studies” button at the top of the platform and then click on “Edit Studies”. Here, you will see a thinkScript Editor. In this editor, you can input the thinkScript code for the GMMA.
Here is an example of how you might script the GMMA:
thinkscriptCopy code#Short-term GMMA
def shortTerm1 = ExpAverage(close,3);
def shortTerm2 = ExpAverage(close,5);
def shortTerm3 = ExpAverage(close,8);
def shortTerm4 = ExpAverage(close,10);
def shortTerm5 = ExpAverage(close,12);
def shortTerm6 = ExpAverage(close,15);

#Long-term GMMA
def longTerm1 = ExpAverage(close,30);
def longTerm2 = ExpAverage(close,35);
def longTerm3 = ExpAverage(close,40);
def longTerm4 = ExpAverage(close,45);
def longTerm5 = ExpAverage(close,50);
def longTerm6 = ExpAverage(close,60);

plot GMMA = shortTerm1 + shortTerm2 + shortTerm3 + shortTerm4 + shortTerm5 + shortTerm6 + longTerm1 + longTerm2 + longTerm3 + longTerm4 + longTerm5 + longTerm6;
- Save the GMMA Indicator: After inputting the code, you can give your new GMMA study a name and click “OK”. Then click “Apply” in the Studies window.
- Analyze the market: With the GMMA added to your chart, you can now start analyzing the market. Look for the interactions between the short-term and long-term moving averages to identify potential trading opportunities.
Adding GMMA to Your Chart in Interactive Brokers’ Trader Workstation: A Step-by-Step Guide
Interactive Brokers’ Trader Workstation (TWS) is a global trading platform known for its broad market access. Similar to some other platforms, TWS doesn’t come with GMMA as a built-in feature, but users can manually create this indicator using its flexible charting tools. Here’s how:
- Open the TWS platform: You can access TWS through the web or their desktop application.
- Choose your trading pair: In the upper left corner, there’s a search bar where you can input the forex pair you’re interested in. Once you’ve typed in your desired pair, click on the correct option from the dropdown menu.
- Open a chart for the pair: Right-click on the selected pair and choose “Chart” from the context menu. A new chart window will open.
- Manually create the GMMA on your chart: Since TWS doesn’t have a built-in GMMA indicator, you’ll need to manually add multiple Exponential Moving Average (EMA) lines to simulate it.
- First, click on the “Edit” button at the top of the chart window, then select “Studies.”
- In the “Studies” window, find and select “Moving Average Exponential” from the “Add Study” dropdown list, and click on the “Add” button.
- You’ll then see options to adjust the parameters of the EMA. Set the “Length” to 3 and click “Apply.”
- Repeat this process for the other EMA periods you want to include in your GMMA (typically, these are 5, 8, 10, 12, and 15 for short-term traders, and 30, 35, 40, 45, 50, and 60 for long-term traders).
- Analyze the market: Now that you’ve added the GMMA to your chart, you can begin to analyze market trends. The interaction between the short-term and long-term EMAs can provide valuable insights into potential trading opportunities.
Adding GMMA to Your Chart in eToro: A Step-by-Step Guide
eToro is a social trading platform popular for its unique feature that allows users to follow and copy trades from other users. Although eToro doesn’t offer GMMA as a built-in indicator, you can still get a similar effect by adding multiple Exponential Moving Averages (EMAs) to your chart. Here’s how you can do it:
- Open the eToro platform: You can access eToro via their website or by using their mobile app.
- Choose your trading pair: On the eToro platform, you can use the search bar at the top to enter the forex pair you’re interested in.
- Open a chart for your pair: Once you’ve selected your pair, click on it to open its summary page. From there, click on the “Chart” tab to open a detailed chart.
- Manually create the GMMA on your chart: Since eToro doesn’t have a prebuilt GMMA indicator, you’ll have to add multiple EMA lines to mimic it.
- Click on the “Studies” button located below the chart, then find and select “Moving Average, Exponential.”
- In the dialog box that appears, you can set the “Length” to 3 and then click “Add.”
- Repeat this process for the other EMA periods you wish to include in your GMMA. The typical periods are 5, 8, 10, 12, and 15 for short-term traders, and 30, 35, 40, 45, 50, and 60 for long-term traders.
- Analyze the market: With your makeshift GMMA now added to the chart, you can start analyzing market trends. Look at how the short-term and long-term EMAs interact to gain insights into potential trading opportunities.
Adding GMMA to Your Chart in NinjaTrader: A Step-by-Step Guide
NinjaTrader is a popular platform for futures, forex, and stock trading. One of its strong points is its customizable charts and built-in indicators. Unfortunately, the GMMA is not a pre-built feature. Still, you can manually set it up by adding multiple Exponential Moving Averages (EMAs) to your chart. Here’s how to do it:
- Open the NinjaTrader platform: NinjaTrader can be accessed via its desktop application.
- Choose your trading pair: Use the search bar or market analyzer to find the forex pair you’re interested in trading.
- Open a chart for your pair: Once you’ve found your pair, right-click on it and select “New chart.” A new chart window will open.
- Manually create the GMMA on your chart: Since NinjaTrader doesn’t have a built-in GMMA indicator, you’ll have to manually add multiple EMA lines to create it.
- Right-click anywhere on your chart and select “Indicators.”
- In the “Indicators” window, find and select “EMA (Exponential Moving Average)” from the “Available” list and click the “Add” button.
- On the right-hand side under “Parameters,” set the “Period” to 3 and click “Apply.”
- Repeat this process for the other EMA periods that are part of the GMMA. The typical periods are 5, 8, 10, 12, and 15 for short-term traders and 30, 35, 40, 45, 50, and 60 for long-term traders.
- Analyze the market: Now that you’ve set up the GMMA on your chart, you can begin analyzing market trends. Look at how the short-term and long-term EMAs interact to understand potential trading opportunities.
Adding GMMA to Your Chart in Plus500: A Step-by-Step Guide
Plus500 is a widely used trading platform with a strong focus on CFD trading. It offers an array of financial instruments including forex, stocks, cryptocurrencies, and more. However, similar to eToro, Plus500 does not offer a built-in GMMA indicator. Traders can create a makeshift GMMA by manually adding multiple Exponential Moving Averages (EMAs) to their chart. Here’s how:
- Open the Plus500 platform: You can access Plus500 through their website or their mobile application.
- Choose your trading pair: Use the search bar at the top of the screen to find the forex pair you want to analyze.
- Open a chart for your pair: Once you’ve selected your pair, click on it to open its summary page. Then click on the “Chart” tab to open the detailed chart.
- Manually create the GMMA on your chart: Since Plus500 doesn’t have a GMMA indicator, you’ll need to add multiple EMA lines manually to create a similar effect.
- Click on the “Indicators” button located below the chart, then find and select “EMA.”
- In the dialog box that pops up, set the “Period” to 3 and then click “Add.”
- Repeat this process for the other EMA periods you wish to include in your GMMA. The typical periods are 5, 8, 10, 12, and 15 for short-term traders, and 30, 35, 40, 45, 50, and 60 for long-term traders.
- Analyze the market: With your makeshift GMMA added to the chart, you can now start analyzing market trends. Watch the interactions between short-term and long-term EMAs to get an idea of potential trading opportunities.
Adding GMMA to Your Chart in IQ Option: A Step-by-Step Guide
IQ Option is a widely used trading platform, popular for its simplicity and user-friendly interface. While it does not have a built-in GMMA indicator, you can create a makeshift GMMA by adding multiple Exponential Moving Averages (EMAs) to your chart. Here’s how to do it:
- Open the IQ Option platform: You can access IQ Option via their website or by using their mobile application.
- Choose your trading pair: Use the search bar at the top of the screen to find the forex pair you want to trade.
- Open a chart for your pair: Once you’ve selected your pair, click on it to open its summary page. Then click on the “Chart” button to open a detailed chart.
- Manually create the GMMA on your chart: Since IQ Option doesn’t have a prebuilt GMMA indicator, you’ll have to add multiple EMA lines manually to mimic it.
- Click on the “Indicators” button located at the bottom left of the chart, then find and select “Moving Averages.”
- In the dialog box that appears, select “EMA” under “Type”, set the “Period” to 3, and then click “Apply.”
- Repeat this process for the other EMA periods you wish to include in your GMMA. The typical periods are 5, 8, 10, 12, and 15 for short-term traders, and 30, 35, 40, 45, 50, and 60 for long-term traders.
- Analyze the market: Now that you’ve set up the GMMA on your chart, you can start analyzing market trends. Look at how the short-term and long-term EMAs interact to get insights into potential trading opportunities.