
Understanding Timeframes in Forex Trading
In the domain of forex trading, the term “timeframe” refers to the period in which a currency trader chooses to observe and analyze price movements. Various trading platforms, such as TradingView and MetaTrader, allow traders to switch between different timeframes according to their strategy.
Selecting Timeframes in TradingView
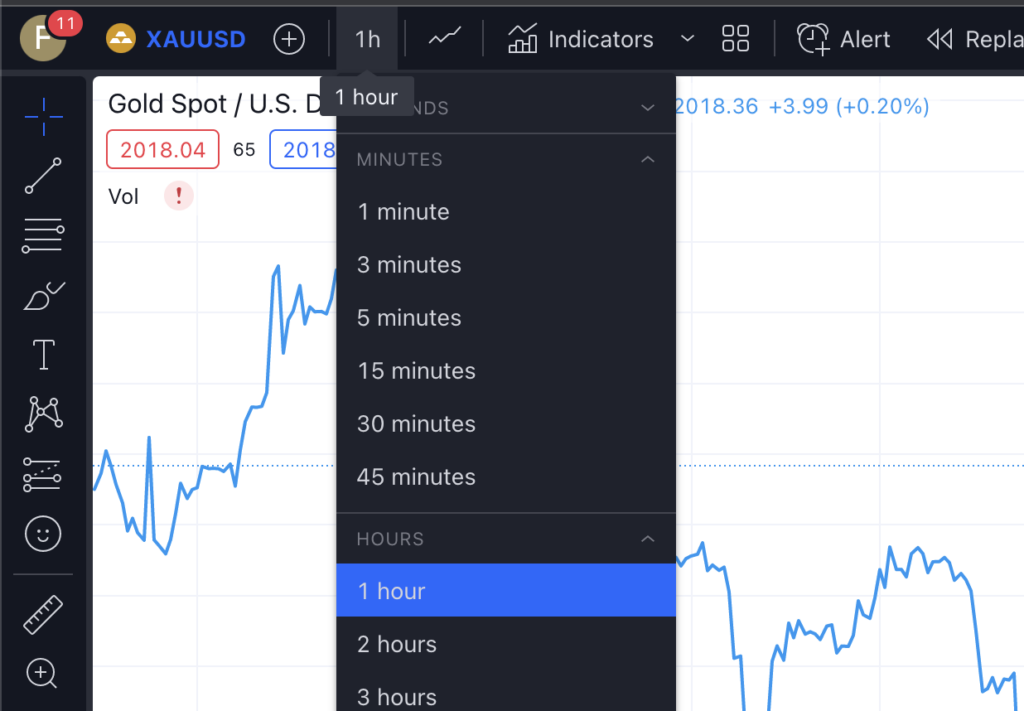
TradingView provides an intuitive interface for analyzing forex markets. When choosing a timeframe, traders simply click on the timeframe selector in the top bar. This drops down a menu featuring a range of options. For instance, “15M” stands for 15 minutes, while “D1” denotes one day. The chosen one will determine the period represented by each candlestick on your chart.
For example, if you select a 1-hour (1H) frame, each candlestick on your chart will represent price changes over one hour. The top of the candlestick shows the highest price during that hour, while the bottom displays the lowest.
Employing the right Frames in MetaTrader

MetaTrader, another popular trading platform, also enables traders to select different timeframes. One simply needs to click on the “Periods” toolbar or use the keyboard shortcuts.
An example: To view a 4-hour (H4) frame, you can press the “H4” button in the Periods toolbar. Just like in TradingView, each candlestick on your chart will reflect the price changes over four hours.
Choosing the Right Chart for Your Timeframe
When dealing with a timeframe, the candlestick chart is often preferable. It provides a wealth of information within a single unit. Each candlestick shows the opening and closing prices, plus the highest and lowest prices during the selected timeframe. This is more comprehensive than a line chart, which only displays the closing price.
A candlestick chart can provide valuable insights into market sentiment within the selected timeframe. For example, a long wick could indicate a reversal of a trend, making it easier for a trader to strategize.
The Ideal Timeframe for Day Trading

Day trading is a style of trading where all positions are closed before the end of the trading day. Consequently, the question arises: which timeframe is best for day trading?
Typically, shorter ones are preferred for day trading. The 15-minute (15M), 30-minute (30M), and 1-hour (1H) timeframes are commonly used. These shorter ones allow traders to identify short-term price movements and trends, which is crucial for day trading.
However, it’s important to note that the ‘best’ timeframe can vary depending on individual trading style and the specific strategy employed. Some traders may find that a 5-minute (5M) frame works best for them, while others prefer the 1-hour (1H).
In Summary
Timeframes are an integral part of forex trading, allowing traders to tailor their chart analysis to their trading strategy. Trading platforms such as TradingView and MetaTrader provide various options in that matter to cater to different trading styles. The choice of timeframe can significantly impact your ability to spot trends and make informed trading decisions. Therefore, it’s crucial to understand and experiment with different ones to find what suits your trading style the best.